The Invisible System Failure
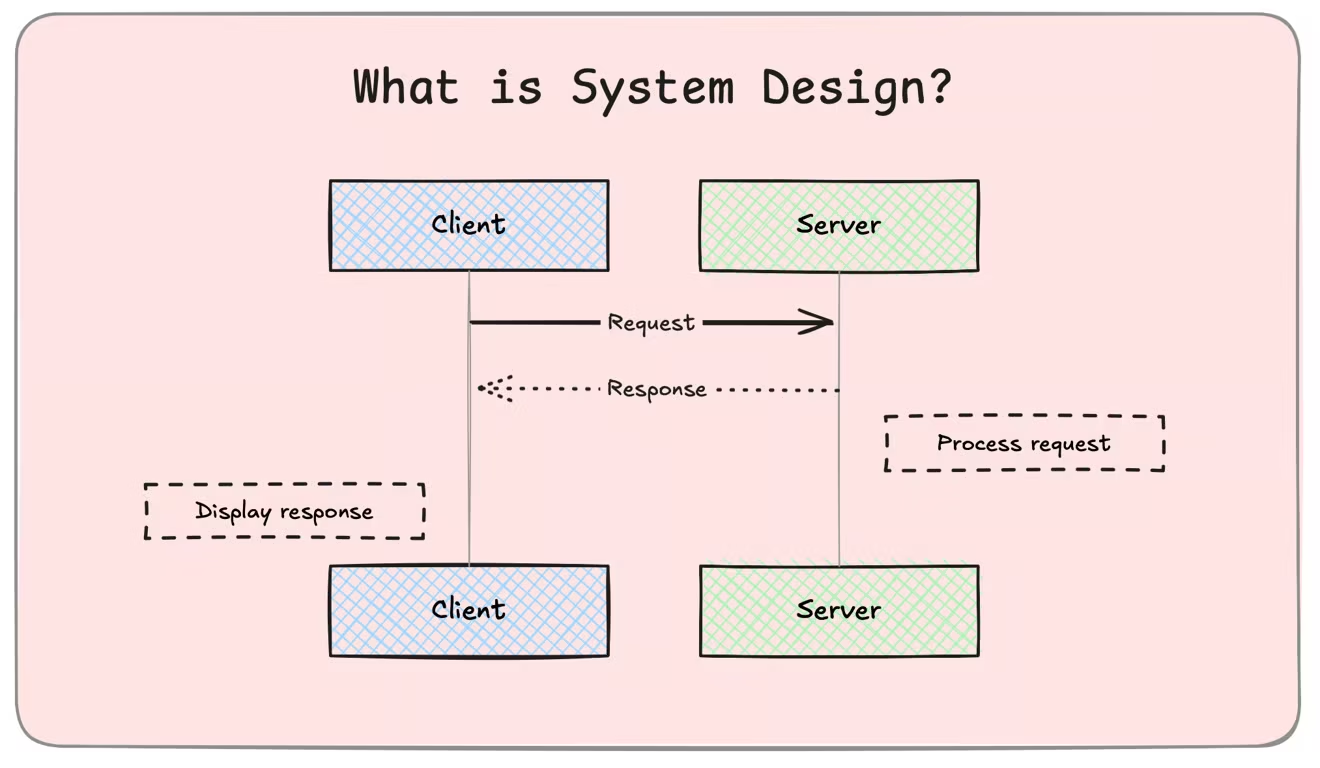
A ride-sharing app experienced random slowdowns, but engineers had no clue why.
Was it a failing database? A traffic spike? A broken API call?
Without logging, monitoring, and observability, diagnosing the problem was impossible. These tools help track system health, detect issues, and debug failures before they impact users.
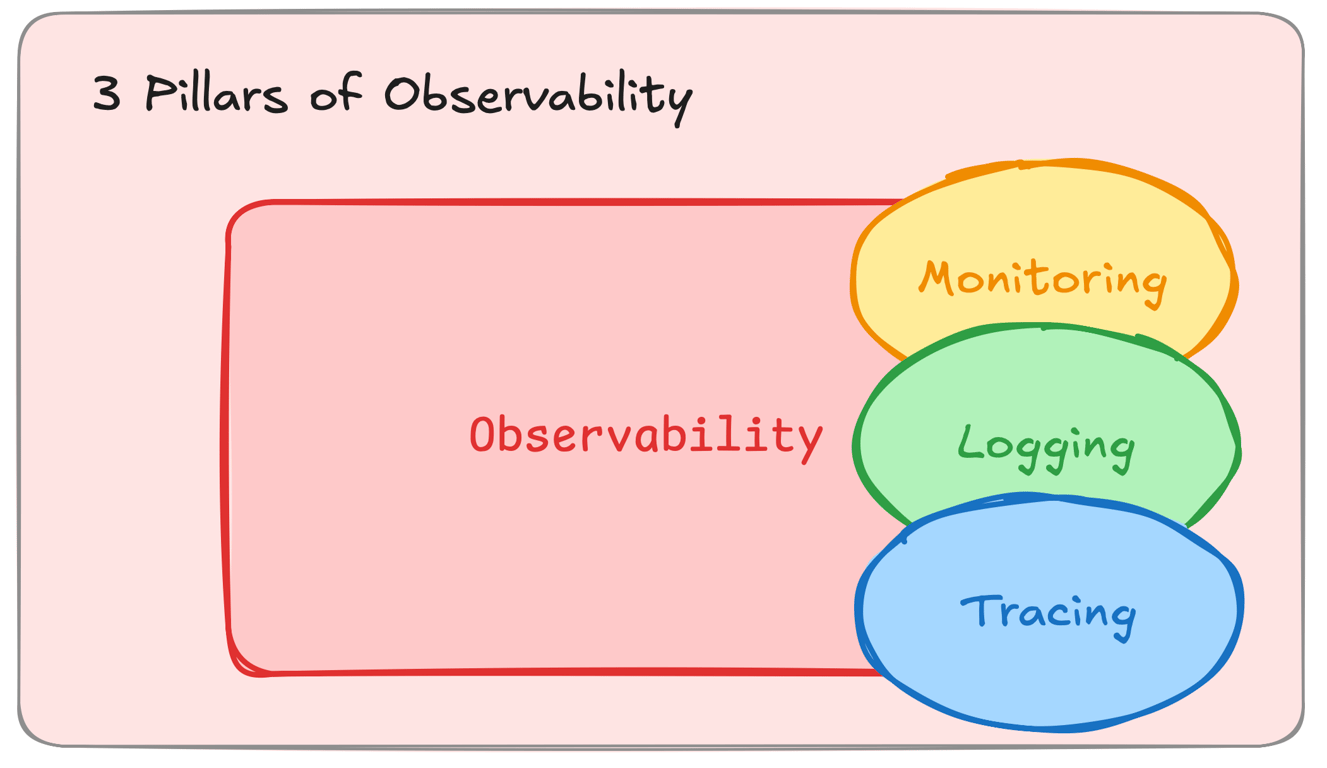
What is Logging, Monitoring & Observability?
While their name suggests most of the thing, but still let's have a look on them:
✔ Logging – Capturing event data (e.g., errors, transactions, API requests). ✔ Monitoring – Tracking system metrics (e.g., CPU usage, request latency). ✔ Observability – Correlating logs, metrics, and traces to diagnose issues.
1. Logging – Recording System Events
Logging provides a record of system activities, helping engineers debug failures.
Example:
[ERROR] 2024-03-01 14:30:12 - Database connection failedTypes of Logs:
Application Logs: API requests, user activities.
System Logs: CPU/memory usage, network failures.
Security Logs: Authentication, failed login attempts.
ELK Stack – Centralized Log Management
ELK (Elasticsearch, Logstash, Kibana) is a powerful logging stack.
How It Works:
Logstash collects logs from different sources.
Elasticsearch indexes and stores logs.
Kibana visualises logs in real time.
Use Case: Netflix uses ELK Stack to analyze millions of log entries per second.
2. Monitoring – Tracking System Performance
Monitoring ensures systems remain healthy, available, and performant.
Key Metrics:
Latency: Time taken for API requests.
CPU & Memory Usage: Detects overloaded servers.
Error Rate: Tracks system failures over time.
Prometheus – Real-Time Metrics Monitoring
Prometheus collects and analyzes system metrics with real-time alerts.
Key Features:
Time-series database – Stores historical performance data.
Pull-based monitoring – Scrapes data from applications.
Alerting system – Detects anomalies (e.g., high error rates).
Use Case: Kubernetes clusters use Prometheus to monitor container performance and prevent failures.
3. Observability – Debugging Complex Systems
Observability helps correlate logs, metrics, and traces to diagnose performance issues.
Example: A slow API request might be due to database latency, discovered by tracing request flows.
Distributed Tracing – Tracking Requests Across Services
How It Works:
A request enters the system (e.g., user orders a product).
Each service adds a trace ID while processing the request.
Engineers analyze traces to find bottlenecks.
Use Case: Uber uses Jaeger and Zipkin for distributed tracing, tracking millions of ride-matching requests per second.
Real-World Use Cases
1. E-Commerce Websites
ELK Stack logs failed transactions for debugging.
Prometheus alerts engineers on high server load.
Distributed tracing tracks checkout API latency.
2. Streaming Platforms
Prometheus monitors video buffering issues.
ELK Stack logs user playback errors.
Distributed tracing identifies slow CDN responses.
3. Cloud-Native Microservices
Prometheus tracks container performance.
ELK Stack analyzes API logs for debugging.
Jaeger traces API calls in Kubernetes clusters.
Conclusion
Observability ensures faster debugging, optimized performance, and high system reliability.
ELK Stack provides powerful log management.
Prometheus tracks system health and alerts engineers.
Distributed tracing enables deep debugging in microservices.
Next, we’ll explore Containerization & Orchestration – Docker, Kubernetes, ECS, Service Meshes.